EAnalysis: new features
- On 1 juillet 2014
EAnalysis is a sound based analysis software developed for MTI Research Centre (De Montfort University, Leicester). Since last updates, EAnalysis contains some new important features. Download EAnalysis – Free for Macintosh OS10.6 or later
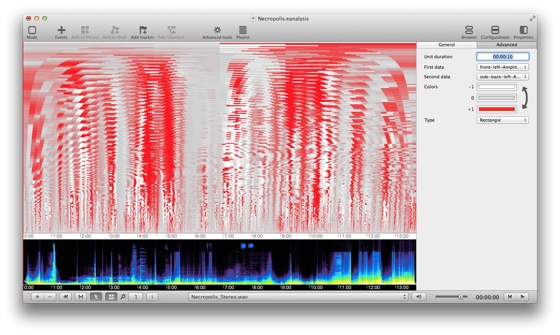
Differential sonogram
The differential sonogram shows only spectral differences, you can analyze morphologies, onsets, spectral motions, etc. 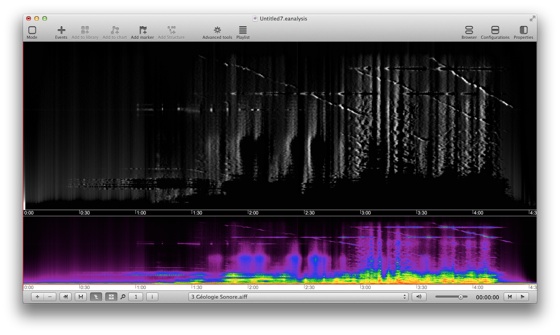
Reference: Jean-Marc Chouvel, Jean Bresson, Carlos Agon, L’analyse musicale différentielle : principes, représentation et application à l’analyse de l’interprétation
Representation of structure
This view draws simple segmentation in several layers with various designs: linear segmentation, formal diagram, similarity matrix from segmentation, or arc diagram from pattern recognition. Here is an example with the fourth designs (from bottom to top: linear, formal diagram, arc diagram, similarity matrix): 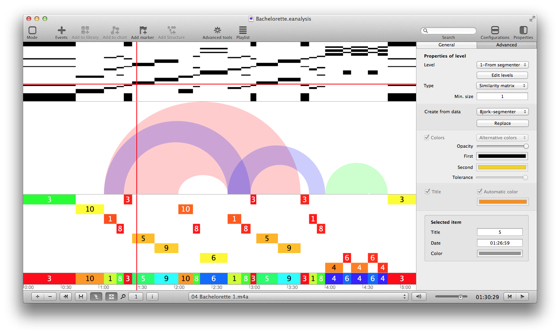
Data visualization: cloud of points
When you import data from an other piece of software (like audio descriptors from Sonic Visualiser), you can draw diagram in two axis and explore it by selecting an area: 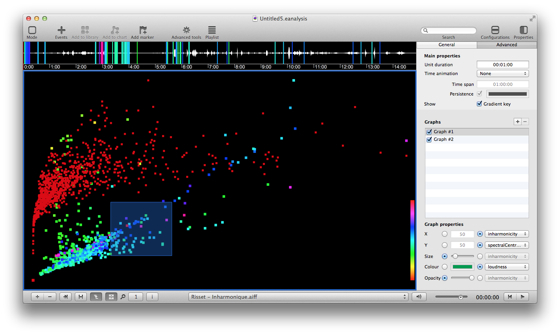
Use CTRL+click to play extracts linked to each point. You can also draw more than one diagram:
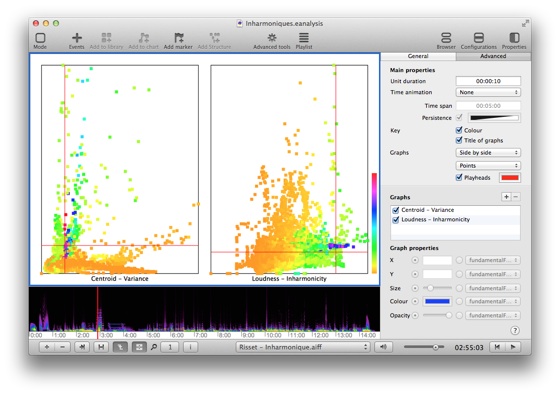
An other example:
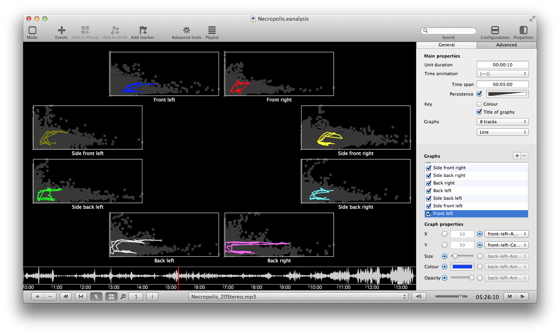
I imagined these representations from the amazing CataRT application developed by Diemo Schwarz for musical creation.
Data visualization: complex line
This second type of view draws three datas in two curves (value, size, and color):
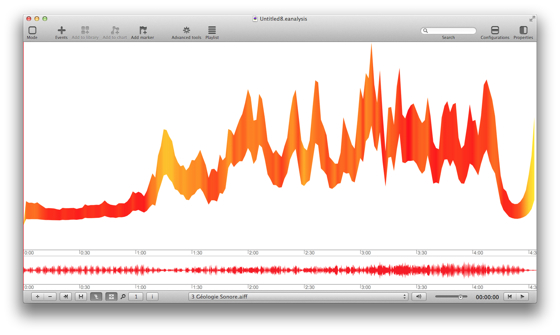
Reference: Malt, Mikhail, Jourdan, Emmanuel, « Le « BSTD » – Une représentation graphique de la brillance et de l’écart type spectral, comme possible représentation de l’évolution du timbre sonore ».
Data visualization: shaded colors
There is also two new types of data visualization: horizontal graph (like a waveform) or gradient like in this example (top): 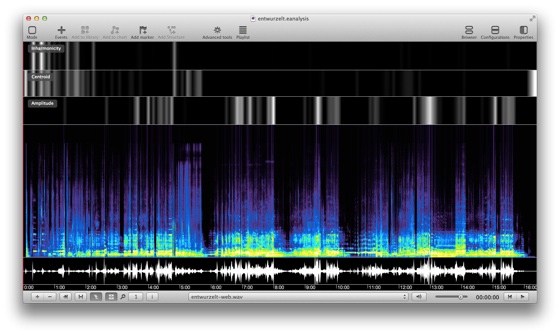
Data hierarchical correlation
I added an other type of view to visualize hierarchical correlation between two set of data:
Reference: Hierarchical Correlation Plots
Analytical events
Lasse Thoresen system of representation is under implementation. The first step is realized: form-building and time-field. Typomorphology will be available for the fall. 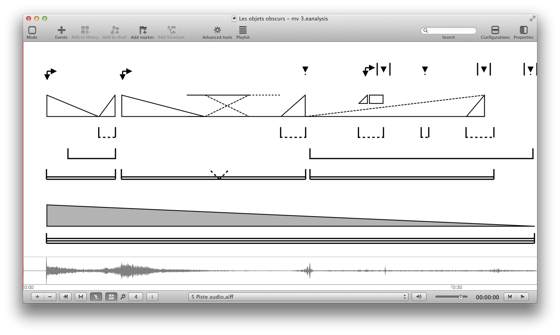
0 Commentaires